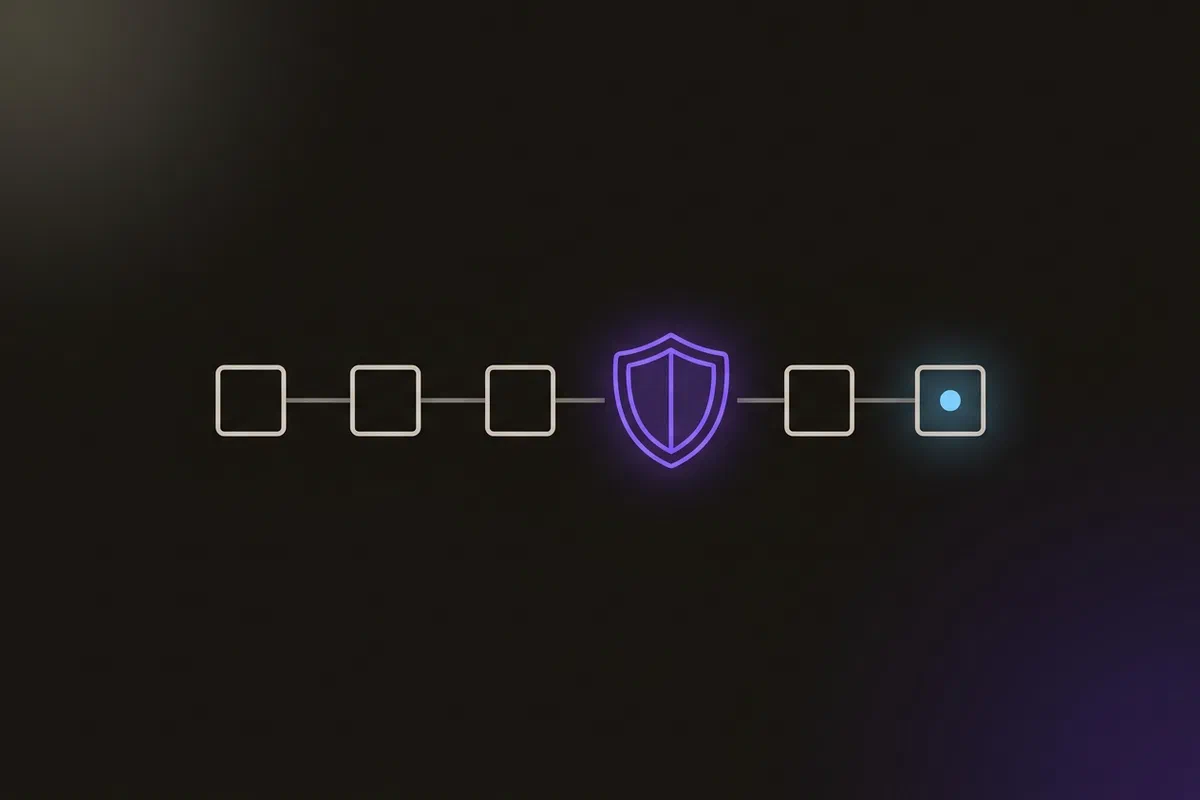


This project builds a CI/CD pipeline where security checks run at every stage: static analysis before the build, a dependency scan, an image scan before the push, and a cluster audit before deployment. Everything runs on Google Cloud, with the infrastructure created by Terraform.
I built it in 2024, while learning DevOps. Reading it again two years later, the pipeline design holds up well, but some of the implementation doesn’t live up to “security-focused”. I’ve kept the original work below and added a review at the end.
The code is in Secure-cloudNative-CI-CD-pipeline.
What it does #
The application is a Java web app (a board game listing site) built with Maven. A change flows through the pipeline like this:

- Commit. A developer pushes to the GitHub repository, which triggers Jenkins.
- Compile and test. Maven compiles the code and runs the unit tests.
- Scan the source. Trivy scans the file system for vulnerable dependencies. SonarQube analyses the code for bugs, code smells and security issues, then reports against a quality gate.
- Build and store the artifact. Maven packages the JAR and publishes it to a Nexus repository.
- Build and scan the image. Docker builds a container image, Trivy scans it, and the image is pushed to Docker Hub.
- Deploy. Jenkins applies the Kubernetes manifests to the cluster and checks that the pods and services came up.
- Notify. An HTML email reports the result, with the Trivy image report attached.
- Monitor. Prometheus and Grafana track the servers and the application, and the Blackbox Exporter checks that the site answers.
| Tool | Role |
|---|---|
| Terraform | Creates the VPC, firewall rules and every VM |
| Jenkins | Runs the pipeline |
| SonarQube | Static code analysis and quality gate |
| Trivy | Dependency (file system) and container image scanning |
| Nexus | Artifact repository for build outputs |
| Docker, Docker Hub | Image build and registry |
| Kubernetes (kubeadm) | One control-plane node and two workers |
| Kubeaudit | Audits the cluster for insecure settings |
| Prometheus, Grafana, Blackbox Exporter | Metrics, dashboards, alerts, endpoint checks |
Phase 1: infrastructure with Terraform #
Everything lives in a custom VPC with its own firewall rules. This is the network as I wrote it:
resource "google_compute_network" "dev-cicd-vpc" {
    auto_create_subnetworks = true
    description             = "VPC for secure CICD pipeline."
    mtu                     = 1460
    name                    = "dev-cicd-vpc"
    project                 = var.gcp_project_id
    routing_mode            = "REGIONAL"
}

## Custom firewall rules
resource "google_compute_firewall" "dev-cicd-vpc-allow-custom" {
    name          = "dev-cicd-vpc-allow-custom"
    project       = var.gcp_project_id
    network       = google_compute_network.dev-cicd-vpc.name
    direction     = "INGRESS"
    priority      = 65534
    source_ranges = ["10.128.0.0/9", "0.0.0.0/0"]
    allow {
        protocol = "tcp"
        ports    = ["80", "443", "465", "6443", "3000-10000", "30000-32767"]
    }
}

## SSH
resource "google_compute_firewall" "dev-cicd-vpc-allow-ssh" {
    network       = google_compute_network.dev-cicd-vpc.name
    project       = var.gcp_project_id
    direction     = "INGRESS"
    priority      = 65534
    source_ranges = ["0.0.0.0/0"]
    name          = "dev-cicd-vpc-allow-ssh"
    allow {
        protocol = "tcp"
        ports    = ["22"]
    }
}
There’s also a rule allowing ICMP from anywhere. (Look closely at those source_ranges. I come back to them in the review.)
Then the VMs: three for Kubernetes (one control plane, two workers), and one each for Jenkins, SonarQube, Nexus and monitoring. They’re all the same shape and differ only in name, machine type, disk size and the startup script that installs their software. This is the control-plane node:
resource "google_compute_instance" "cluster-instances-node-master" {
    name         = "cluster-instances-node-master"
    machine_type = "e2-medium"
    zone         = "asia-south1-c"

    boot_disk {
        initialize_params {
            image = "projects/ubuntu-os-cloud/global/images/ubuntu-2004-focal-v20240307b"
            size  = 25
            type  = "pd-balanced"
        }
    }

    metadata = {
        startup-script = file("./scripts/masterVM.sh")
    }

    network_interface {
        network = google_compute_network.dev-cicd-vpc.name
        access_config {
            network_tier = "STANDARD"
        }
    }

    service_account {
        email  = var.gcp_service_account_email
        scopes = ["https://www.googleapis.com/auth/cloud-platform"]
    }

    shielded_instance_config {
        enable_integrity_monitoring = true
        enable_secure_boot          = false
        enable_vtpm                 = true
    }

    tags = ["http-server", "https-server", "lb-health-check"]
}
The startup scripts (scripts/*.sh in the repo) install Kubernetes, Jenkins, SonarQube, Nexus and the monitoring stack when each VM first boots, so the whole environment comes up from one terraform apply.
Phase 2: source control and notifications #
The application code lives in a private GitHub repository, with feature branches merged into main. Jenkins sends an HTML email at the end of every run, success or failure, with the Trivy image report attached, so the result reaches people without anyone opening Jenkins.
Phase 3: the pipeline #
The pipeline is a declarative Jenkinsfile. Trimmed to its stages, it looks like this:
pipeline {
    agent any
    tools { jdk 'jdk17'; maven 'maven3' }
    environment { SCANNER_HOME = tool 'sonar-scanner' }

    stages {
        stage('Compile') { steps { sh "mvn compile" } }
        stage('Test')    { steps { sh "mvn test" } }

        stage('File System Scan') {
            steps { sh "trivy fs --format table -o trivy-fs-report.html ." }
        }
        stage('Sonarqube Analysis') {
            steps {
                withSonarQubeEnv('sonar') {
                    sh ''' $SCANNER_HOME/bin/sonar-scanner -Dsonar.projectKey=BoardGame -Dsonar.sources=. -Dsonar.java.binaries=. '''
                }
            }
        }
        stage('Quality Gate') {
            steps { script { waitForQualityGate abortPipeline: false, credentialsId: 'sonarqube-token' } }
        }

        stage('Build')                    { steps { sh "mvn package" } }
        stage('Publish Artifact to Nexus') { steps { withMaven(/* ... */) { sh "mvn deploy" } } }

        stage('Build and Tag Docker Image') {
            steps { script { withDockerRegistry(credentialsId: 'docker-cred', toolName: 'docker') {
                sh "docker image build -t che01tan/boardgame:latest ."
            } } }
        }
        stage('Docker Image Scan') {
            steps { sh "trivy image --format table -o trivy-image-report.html chetanthapliyal/boardgame:latest" }
        }
        stage('Push Docker Image') {
            steps { script { withDockerRegistry([credentialsId: 'docker-cred', toolName: 'docker']) {
                sh "docker push che01tan/boardgame:latest"
            } } }
        }

        stage('Deploy to Kubernetes') {
            steps { withKubeConfig(credentialsId: 'k8-cred', namespace: 'webapps', serverUrl: 'https://<control-plane>:6443') {
                sh "kubectl apply -f deployment.yaml"
            } }
        }
    }
    post { always { /* HTML email with status and the Trivy report */ } }
}
Jenkins talks to the cluster through a dedicated service account in the webapps namespace, bound to a namespaced Role, rather than with the cluster-admin kubeconfig.
Phase 4: monitoring #
The monitoring VM runs Prometheus and Grafana. Node Exporter on the servers reports CPU, memory and disk. The Blackbox Exporter probes the deployed site’s URL, so Grafana shows both “is the server healthy?” and “can users reach the site?”.

What I’d lock down today #
The pipeline’s shape is right: scan early, scan the image, give the deploy step its own account, notify on every run. But reviewing it now, several pieces don’t enforce what the post claims. This is what I’d change, roughly in order of risk.
1. The image scan checks a different image. The build tags che01tan/boardgame:latest, but the scan runs against chetanthapliyal/boardgame:latest, a different repository name. The scan step either fails to find the image or scans an old one, and either way the image that gets pushed was never scanned. Use one variable for the image name in every stage.
2. None of the security checks can fail the build. waitForQualityGate abortPipeline: false reports the quality gate result and carries on. Both Trivy scans write a report and exit 0 whatever they find. The checks inform; they don’t gate. I’d set abortPipeline: true, and run Trivy with --exit-code 1 --severity HIGH,CRITICAL so a serious finding stops the pipeline.
3. The firewall is open to the internet. 0.0.0.0/0 appears on SSH, on the Kubernetes API server (6443), on every NodePort (30000–32767) and on ports 3000–10000, which covers Jenkins, SonarQube, Nexus, Grafana and Prometheus. Every admin tool in the project was reachable from anywhere. Today I’d:
- remove public IPs from everything except a load balancer in front of the app,
- reach admin tools through Identity-Aware Proxy (IAP) TCP forwarding or a VPN, and allow SSH only from IAP’s range (
35.235.240.0/20), - keep the API server and NodePorts internal to the VPC.
4. :latest everywhere. The deployed image is :latest, so a rollback can’t name what to roll back to, and two nodes can run different images under the same tag. Tag each build with the commit SHA, and deploy that tag.
5. Broad service account scopes. Every VM uses the cloud-platform scope, which lets the instance call any Google Cloud API the service account is allowed to. I’d give each VM its own service account with only the roles it needs (often none).
6. End-of-life base image. Ubuntu 20.04 reached the end of standard support in 2025. Use a current LTS image, and enable Secure Boot, which is off here.
7. The deploy Role is broader than deploying needs. It’s namespaced, which is good, but it grants access to Secrets, RBAC objects, nodes and namespaces as well as Deployments and Services. A deploy account needs to update workloads in one namespace, and little else. I’d cut it to get, list, create, update and patch on Deployments, Services and ConfigMaps.
8. Secrets and personal data in a public repo. The repository is public, and the Jenkinsfile contains a personal email address. No credentials are committed (they’re Jenkins credentials, referenced by ID), which is right, but I’d still scrub the email and the internal API server address.
Points 1 and 2 matter most. A pipeline with scanners that can’t fail is a reporting tool, not a security control, and point 1 means the report was about the wrong image anyway.
Architecture takeaways #
A check only counts if it can stop the release #
Security tooling in a pipeline is only as strong as its failure mode. If a scan or quality gate can’t fail the build, the pipeline produces reports that someone might read. Decide for each check what severity blocks a release, and make the pipeline enforce it.
Reduce reachability before adding scanners #
Scanning images and auditing the cluster are valuable, but the biggest risk in this design was simpler: every admin interface was on the internet. Removing public exposure (private IPs, IAP or a VPN, internal-only control planes) shrinks what an attacker can reach at all, before any scanner gets involved.