


This project sets up monitoring that tells me when something breaks, without me watching a dashboard. Prometheus collects server metrics and probes websites, and Alertmanager sends an email when a site goes down, a VM disappears, or a server runs low on memory, disk or CPU.
It runs on two VMs on Google Cloud, created with Terraform. The code is in real-time-devops-monitoring.
What it monitors #
| Scenario | Alert |
|---|---|
| A website is unreachable for more than a minute | WebsiteDown |
| A VM or exporter stops responding | InstanceDown, ServiceUnavailable |
| A server runs low on memory | HostOutOfMemory, HighMemoryUsage |
| A server runs low on disk | HostOutOfDiskSpace, FileSystemFull |
| A server’s CPU stays high | HostHighCpuLoad |
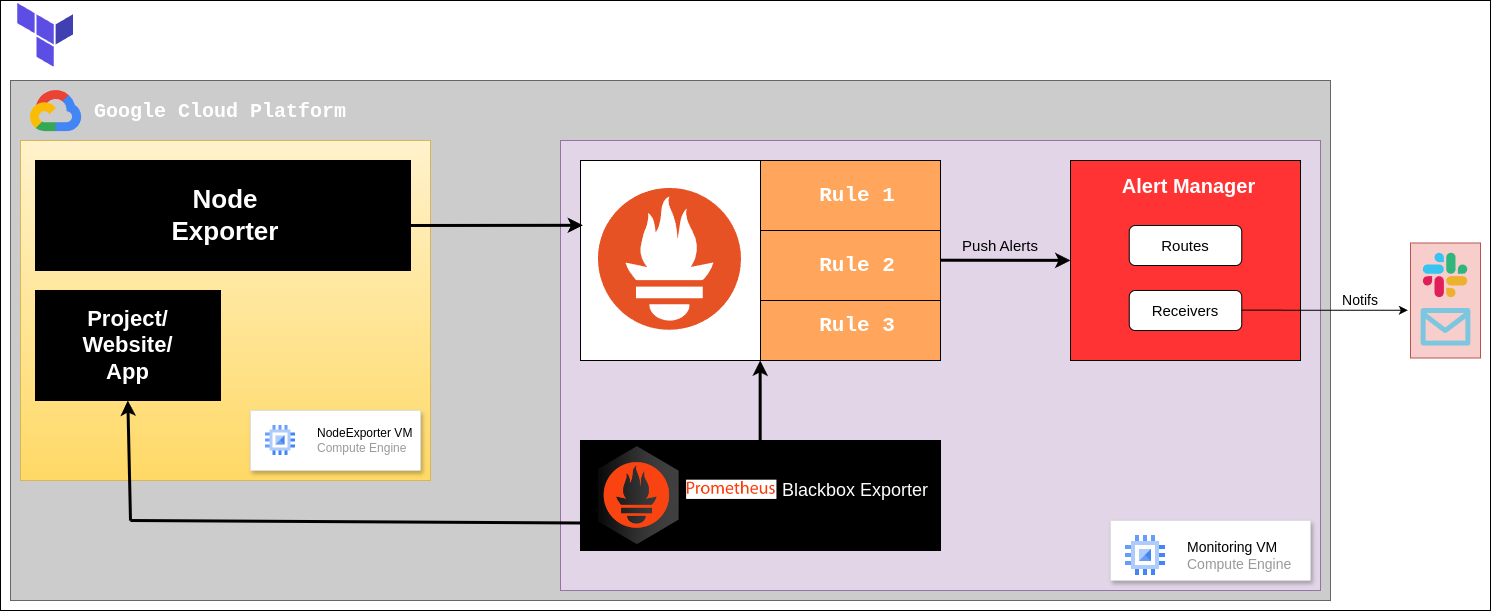
The components:
- Prometheus scrapes metrics on a schedule, stores them, and evaluates alert rules against them.
- Node Exporter runs on each monitored server and exposes CPU, memory, disk and network metrics.
- Blackbox Exporter probes endpoints from the outside (HTTP, HTTPS, TCP, ICMP, DNS) and reports whether they answered.
- Alertmanager receives alerts from Prometheus, groups and de-duplicates them, and sends notifications, here by email.
The two VMs split the roles: the monitoring VM runs Prometheus, Blackbox Exporter and Alertmanager, and the application VM runs the app and Node Exporter.

Step 1: create the VMs #
Terraform creates the network and both VMs, and a startup script on each one installs its tools on first boot:
git clone https://github.com/ChetanThapliyal/real-time-devops-monitoring.git
cd real-time-devops-monitoring/Infra
terraform init
# add your service account key and a tfvars file
terraform apply
Step 2: write the alert rules #
Alert rules live in their own file, /opt/prometheus/alert_rules.yml. Each rule has a PromQL expression (expr), how long it must stay true before firing (for), a severity label that Alertmanager can route on, and human-readable annotations.
groups:
- name: alert_rules
  rules:
    - alert: InstanceDown
      expr: up == 0
      for: 1m
      labels:
        severity: "critical"
      annotations:
        summary: "Endpoint {{ $labels.instance }} down"
        description: "{{ $labels.instance }} of job {{ $labels.job }} has been down for more than 1 minute."

    - alert: WebsiteDown
      expr: probe_success == 0
      for: 1m
      labels:
        severity: critical
      annotations:
        description: The website at {{ $labels.instance }} is down.
        summary: Website down

    - alert: HostOutOfMemory
      expr: node_memory_MemAvailable / node_memory_MemTotal * 100 < 25
      for: 5m
      labels:
        severity: warning
      annotations:
        summary: "Host out of memory (instance {{ $labels.instance }})"

    - alert: HostOutOfDiskSpace
      expr: (node_filesystem_avail{mountpoint="/"} * 100) / node_filesystem_size{mountpoint="/"} < 50
      for: 1s
      labels:
        severity: warning
      annotations:
        summary: "Host out of disk space (instance {{ $labels.instance }})"

    - alert: HostHighCpuLoad
      expr: (sum by (instance) (irate(node_cpu{job="node_exporter_metrics",mode="idle"}[5m]))) > 80
      for: 5m
      labels:
        severity: warning
      annotations:
        summary: "Host high CPU load (instance {{ $labels.instance }})"

    - alert: ServiceUnavailable
      expr: up{job="node_exporter"} == 0
      for: 2m
      labels:
        severity: critical
      annotations:
        summary: "Service Unavailable (instance {{ $labels.instance }})"

    - alert: HighMemoryUsage
      expr: (node_memory_Active / node_memory_MemTotal) * 100 > 90
      for: 10m
      labels:
        severity: critical
      annotations:
        summary: "High Memory Usage (instance {{ $labels.instance }})"

    - alert: FileSystemFull
      expr: (node_filesystem_avail / node_filesystem_size) * 100 < 10
      for: 5m
      labels:
        severity: critical
      annotations:
        summary: "File System Almost Full (instance {{ $labels.instance }})"
The first two rules are the core of the project: up == 0 catches any scrape target that stops answering, and probe_success == 0 catches any website the Blackbox Exporter can’t reach. Several of the resource rules have problems; the review at the end covers them.
Step 3: configure Prometheus #
Prometheus reads /opt/prometheus/prometheus.yml. Four sections matter here.
Global settings set how often Prometheus scrapes targets and evaluates rules. 15 seconds is a sensible default for a small setup:
global:
  scrape_interval: 15s
  evaluation_interval: 15s
Alerting tells Prometheus where Alertmanager is:
alerting:
  alertmanagers:
    - static_configs:
        - targets:
            - <monitoring-vm-ip>:9093
Rule files loads the rules from Step 2:
rule_files:
  - alert_rules.yml
Scrape configs list what to collect. Besides Prometheus itself, there’s one job for Node Exporter and one for the Blackbox Exporter:
scrape_configs:
  - job_name: "prometheus"
    static_configs:
      - targets: ["localhost:9090"]

  - job_name: "node_exporter"
    static_configs:
      - targets: ["<app-vm-ip>:9100"]

  - job_name: "blackbox"
    metrics_path: /probe
    params:
      module: [http_2xx]
    static_configs:
      - targets:
        - http://prometheus.io
        - https://prometheus.io
        - http://<app-vm-ip>:8080/
    relabel_configs:
      - source_labels: [__address__]
        target_label: __param_target
      - source_labels: [__param_target]
        target_label: instance
      - target_label: __address__
        replacement: <monitoring-vm-ip>:9115
The Blackbox job is the one that confuses people, because of the relabel_configs. Prometheus doesn’t scrape the websites directly. It scrapes the Blackbox Exporter, and passes the website as a parameter. The three relabel rules do exactly that:
- Copy each target URL into the
targetquery parameter (__param_target). - Keep the URL as the
instancelabel, so alerts name the website, not the exporter. - Point the actual scrape at the Blackbox Exporter on port 9115.
So for each URL, Prometheus requests http://<monitoring-vm-ip>:9115/probe?module=http_2xx&target=<url>, and the exporter replies with probe_success and timing metrics. The blackbox_exporter README has more examples.
After editing, restart Prometheus so it loads the new configuration.
Step 4: send email with Alertmanager #
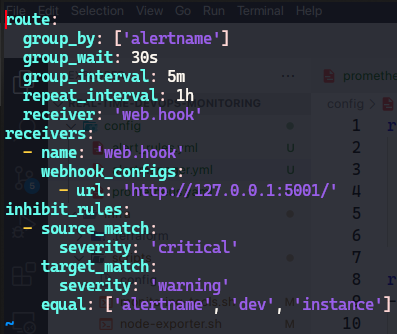
alertmanager.yml has three parts. The route decides how alerts are grouped and how often they’re sent:
route:
  group_by: ['alertname']
  group_wait: 30s
  group_interval: 5m
  repeat_interval: 1h
  receiver: 'email-notifications'
group_wait holds the first notification for 30 seconds so related alerts arrive in one email. group_interval limits how often new alerts in the same group are sent, and repeat_interval re-sends an alert that’s still firing every hour.
The receiver says where notifications go. For Gmail, use an app password, never your account password:
receivers:
- name: 'email-notifications'
  email_configs:
  - to: your_email@tld.com
    from: test@tld.com
    smarthost: smtp.gmail.com:587
    auth_username: your_email
    auth_identity: your_email
    auth_password: "xxxx xxxx xxxx xxxx"
    send_resolved: true
send_resolved: true sends a second email when the problem clears, so you know it’s over without checking.
Inhibit rules mute lower-severity alerts while a related critical one is firing, so one failure doesn’t send five emails:
inhibit_rules:
  - source_match:
      severity: 'critical'
    target_match:
      severity: 'warning'
    equal: ['alertname', 'dev', 'instance']
Step 5: verify, then break something #
Open Prometheus at http://<monitoring-vm-ip>:9090 and check that every target shows as up.

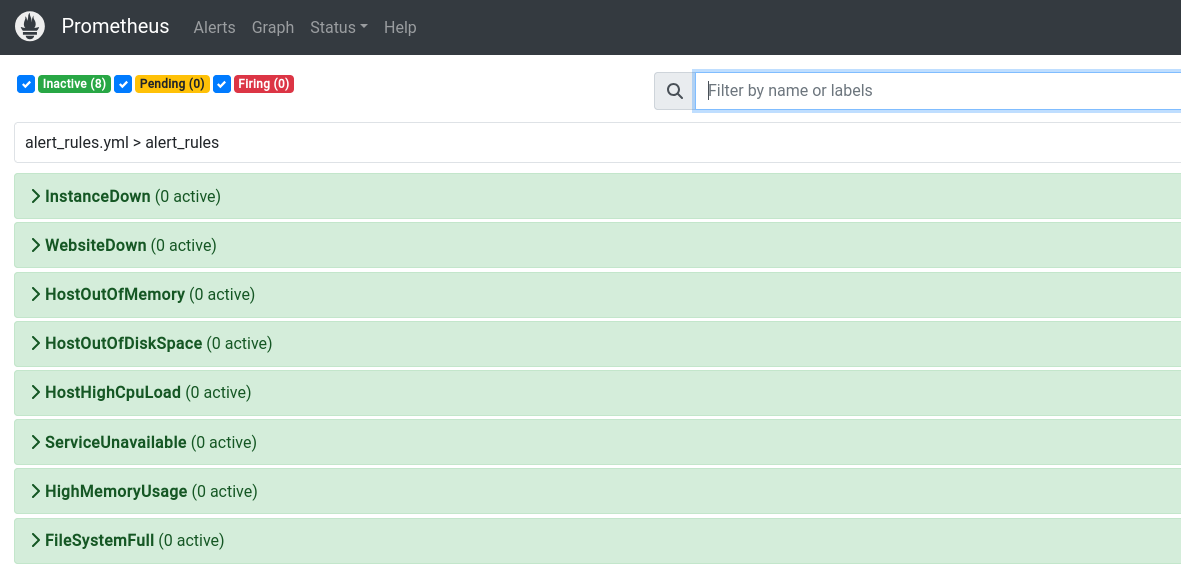
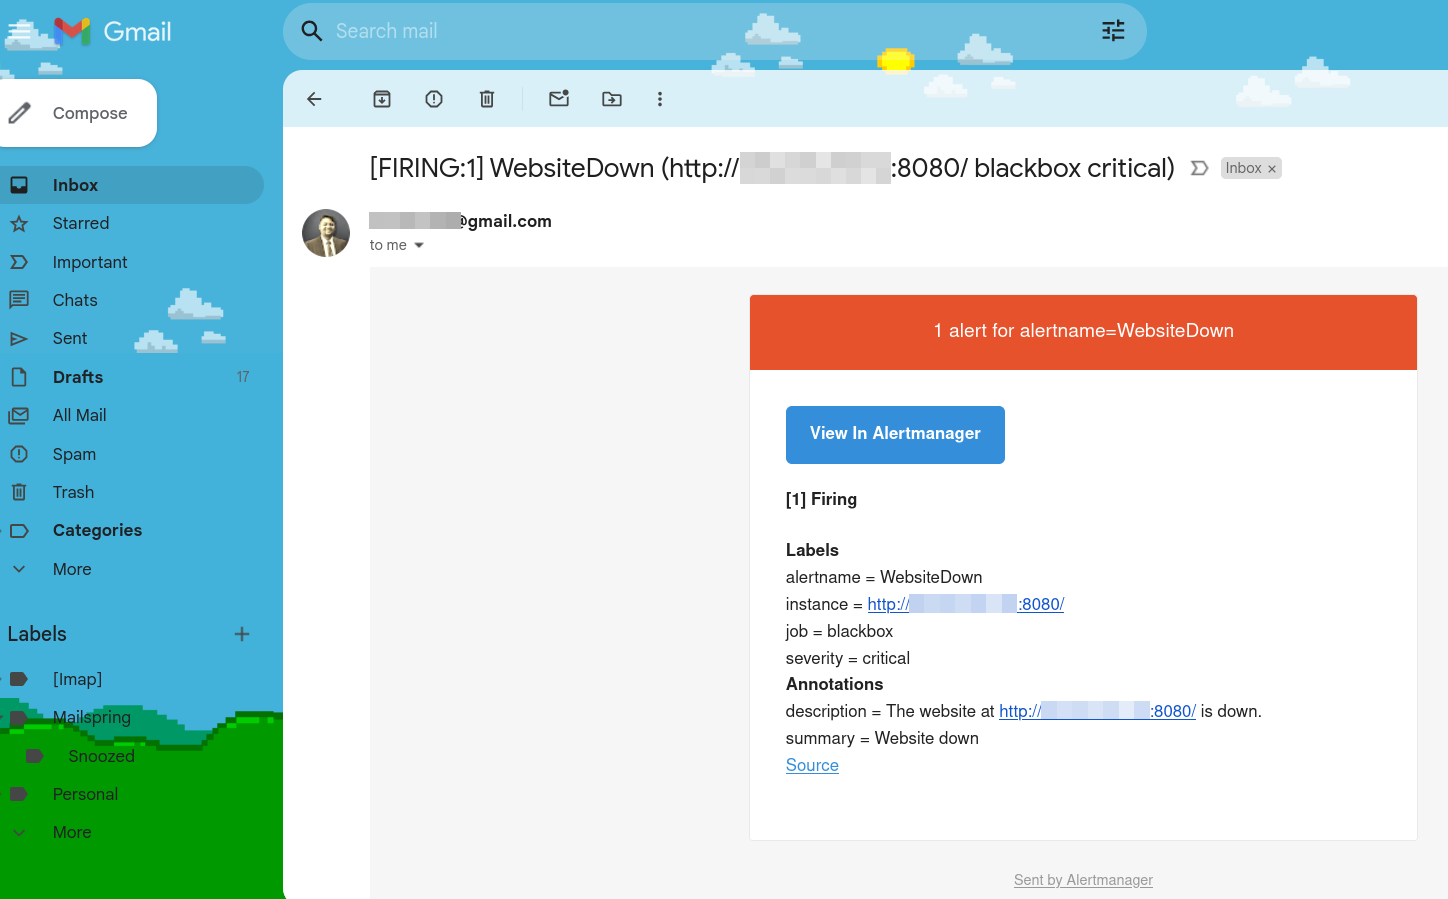
The real test is a failure. I stopped the application on the app VM by killing its Java process:
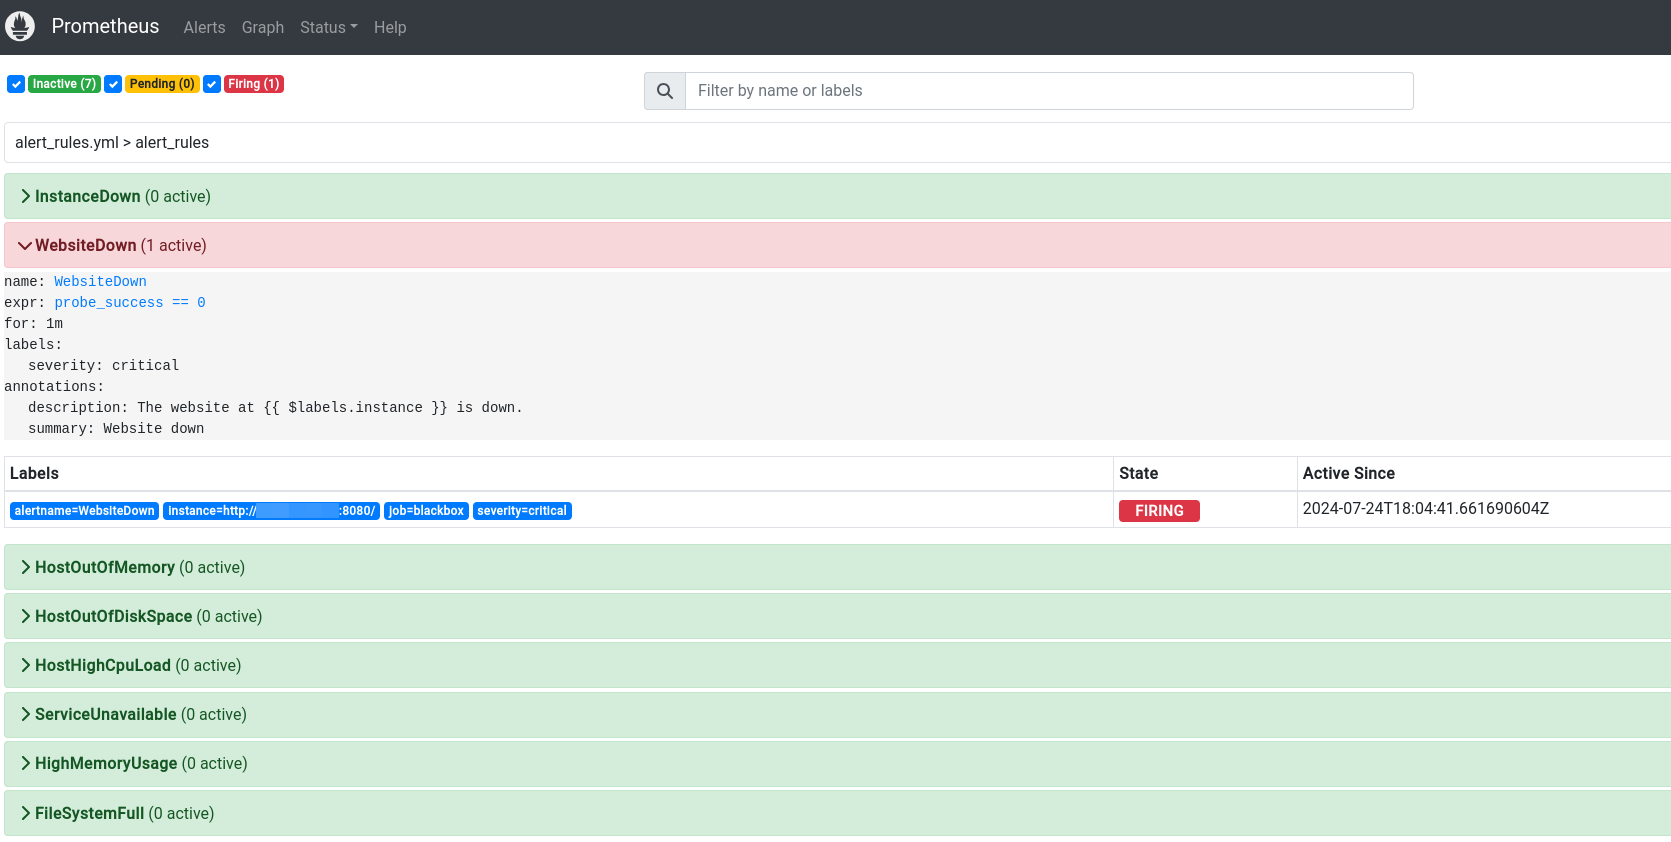
Within about a minute, WebsiteDown fired and the email arrived:
What I’d change today #
The website and instance alerts worked, and I proved they did. Reviewing the rest now, several pieces wouldn’t have worked, and the setup is more exposed than it should be.
1. Four resource alerts could never fire. Node Exporter renamed its metrics in 2018 (version 0.16), adding unit suffixes. node_memory_MemAvailable, node_memory_Active, node_filesystem_avail and node_cpu don’t exist in any recent version, so HostOutOfMemory, HighMemoryUsage, FileSystemFull and HostHighCpuLoad evaluate to nothing, silently. The current names are node_memory_MemAvailable_bytes, node_memory_Active_bytes, node_filesystem_avail_bytes and node_cpu_seconds_total. I only tested the website alert, so nothing showed that the others were dead. Every alert deserves its own test.
2. The CPU rule is wrong even with the right name. It sums the idle rate, so it would fire when the CPU is quiet. Its job label (node_exporter_metrics) doesn’t match the real job (node_exporter) either. The usual form is:
100 - (avg by (instance) (rate(node_cpu_seconds_total{mode="idle"}[5m])) * 100) > 803. Thresholds that page for nothing. HostOutOfDiskSpace fires at under 50% free with for: 1s, which is a busy disk, not a full one, and one bad scrape would trigger it. I’d use a prediction instead (predict_linear on free space, “full within 24 hours”), with a for of several minutes.
4. Validate before restarting. I restarted Prometheus by killing the process and starting it again in the background. promtool check rules alert_rules.yml and promtool check config prometheus.yml catch syntax errors first, and running Prometheus as a systemd service (reloaded with systemctl reload or the /-/reload endpoint) is safer than a backgrounded process.
5. Everything is scraped over public IPs. Node Exporter (9100), Blackbox Exporter (9115), Prometheus (9090) and Alertmanager (9093) have no authentication by default, and this setup reached them over public addresses. I’d scrape over private VPC addresses only, keep those ports closed to the internet, and reach the UIs through IAP or a VPN.
6. The SMTP password sits in the config file. Alertmanager supports auth_password_file, which keeps the secret out of the YAML and out of Git.
7. The monitor can’t report its own death. If the monitoring VM goes down, Prometheus and Alertmanager go with it, and nothing alerts. A “dead man’s switch”, an always-firing alert sent to an external service that pages when it stops arriving, closes that gap.
Architecture takeaways #
An alert you haven’t seen fire is a hypothesis #
Writing an alert rule proves nothing about whether it works. Here, four rules referenced metrics that didn’t exist, and the configuration loaded without complaint. Each alert needs a test that triggers it on purpose, like killing the app did for WebsiteDown.
Watch from outside the thing you’re watching #
Blackbox probing is the right instinct: it checks what users see, not what the server reports about itself. The same idea applies to the monitoring stack, which can’t report its own failure. Something outside it has to notice the silence.