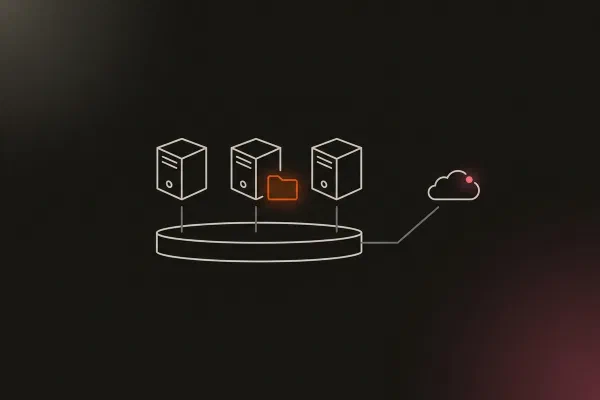


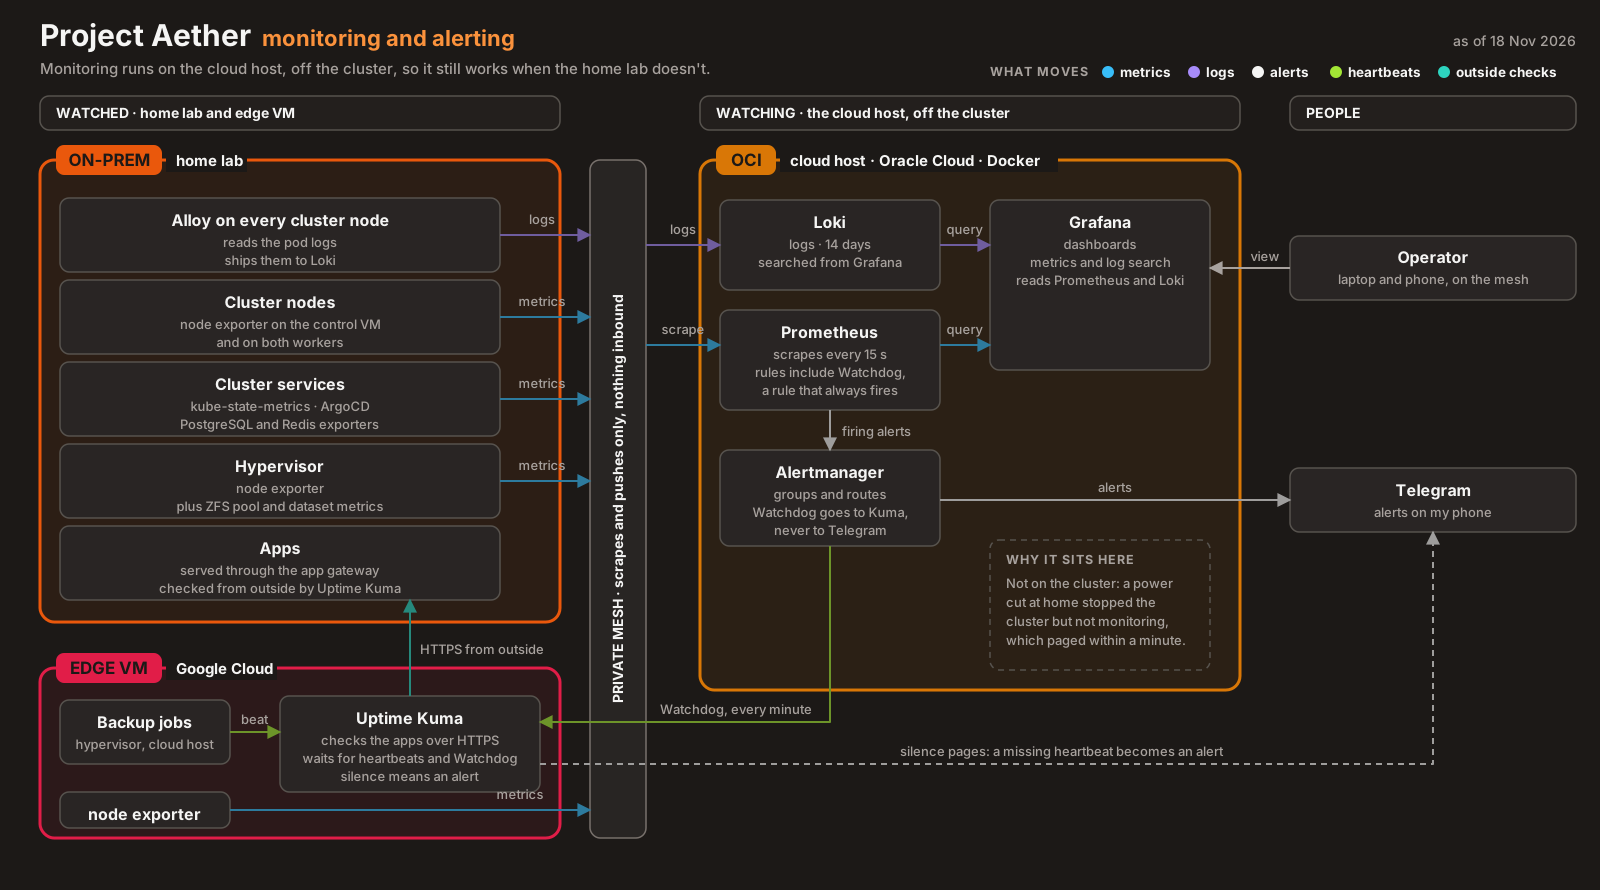
When the power cut in part 12 took the whole homelab down, an alert reached my phone within a minute. That only worked because none of the monitoring ran in the homelab. Prometheus, Loki, Alertmanager and Grafana all live on the app host, an always-free Oracle Cloud VM, and the cluster runs nothing but small agents that send data out.
That split was a deliberate choice in ADR-019, made for memory first and resilience second. Since then, the memory budget I wrote down turned out to be wrong, the log agent changed from Promtail to Grafana Alloy, and the hypervisor started shipping its own logs.
This post covers what runs where, what the agents actually cost, how the agent swap went without a gap, and the alerts that check the monitoring itself.
What runs where #
| Where | What | Role |
|---|---|---|
| Each K3s node | Grafana Alloy (DaemonSet), node exporter | Read pod logs and node metrics, send them out |
| The cluster | kube-state-metrics, ArgoCD and database exporters | Expose cluster and app state for scraping |
| The hypervisor | Node exporter, ZFS and SMART metrics, Alloy for the journal | The hardware underneath everything |
| The app host | Prometheus, Loki, Alertmanager, Grafana | Store, query and alert |
| The DMZ observer | Uptime Kuma | Watch the alerting path from outside |
Everything crosses the tailnet. Each flow has its own grant, scoped to the one port it needs, so the cluster can push logs to Loki and nothing else on the app host.
Why not run it on the cluster #
Two reasons, in the order they mattered.
Memory. Each worker has about 3.5 GB to give, and the apps need it. ADR-019 estimated an in-cluster Loki at about 500 MiB plus its chunk store, and an Elasticsearch-style stack at 2 to 4 GB of heap. The same ADR put Loki at 250 to 350 MiB on the app host, which has 12 GB.
Failure domains. Monitoring that runs on the cluster goes down with the cluster, at exactly the moment you need it. Part 12 was that moment, and the alert arrived anyway.
The cost is a dependency on the tailnet. If the homelab loses its connection, the agents retry for a while and then drop what they can’t send. The logs are still on the nodes, but not in Loki.
I looked at VictoriaLogs too. It’s lighter and compresses better, but it needs a third-party Grafana plugin, and Loki fits easily on the app host.
The memory budget was wrong #
The ADR set a budget of under 30 MiB per node for the log agent and about 70 MiB for the whole cluster. Those were config intentions, not measurements.
The first sign was an incident: two Promtail pods sat at 57 to 59 MiB of their 64 MiB limit with their retry buffers growing, close to being killed. The limit went up to 128 MiB, and when I measured properly, Promtail was using 100 to 112 MiB per node. It had never met the budget.
That incident was the one where two nodes shipped their logs nowhere for days because of a DNS setting Helm silently dropped. I’ve written it up twice already, in Green Is Not a Status and Seven Silent GitOps Gotchas, so here’s only the part that changed the design: it was found by a phase exit gate that asked “do all three nodes appear in Loki?”, and nothing was watching for it in between.
That gap now has an alert, generated once per node:
- alert: LogShippingStalled
  expr: 'absent_over_time({node_name="{{ node }}"}[15m])'
  for: 15m
  labels:
    severity: warning
    tier: logging
    node_name: "{{ node }}"
  annotations:
    summary: "No logs from {{ node }} have reached Loki for 30 minutes"
It’s a Loki rule, not a Prometheus one, so it checks what actually arrived rather than what the agent says it sent.
From Promtail to Alloy #
Two things pushed the change (ADR-019 addendum). Promtail is deprecated upstream. And its chart needed hostNetwork: true to reach Loki, which meant the monitoring namespace’s NetworkPolicy never applied to it. The egress rule allowing Loki and nothing else existed only on paper.
Alloy runs on the pod network. A pod reaches the tailnet through its node’s NAT, which I tested before the cut-over, so the NetworkPolicy now applies: Loki is reachable, and the internet and every other port on the app host aren’t.
controller:
  type: daemonset
  # No hostNetwork (HARD-15): pods reach Loki over the tailnet through
  # the node's NAT, so the monitoring NetworkPolicy applies to Alloy.
alloy:
  enableReporting: false   # no usage reports to Grafana Labs (egress is denied anyway)
  # Read positions live on the node, so a restart doesn't re-send every log.
  storagePath: /var/lib/alloy
  mounts:
    varlog: true           # read-only /var/log for /var/log/pods
  resources:
    requests: { cpu: 10m, memory: 64Mi }
    limits:   { cpu: 200m, memory: 256Mi }
The labels match Promtail’s exactly: namespace, pod, container, app, node_name and the rest. That was the most important part of the swap. Existing streams, saved queries and the LogShippingStalled rule (which needs node_name) carried over without a single edit.
The cut-over was one ArgoCD sync that removed Promtail and added Alloy. Alloy started with no saved positions, so it re-read every log file on the node. Loki refused the lines older than its one-hour window, which Promtail had already shipped, and accepted the rest. No gap and no duplicate streams.
Measured afterwards: Alloy used 45 to 88 MiB per node, against Promtail’s 100 to 112 on the same nodes. Its config-reload sidecar grew from 6 to 39 MiB in its first day, so its limit went from 48 to 64 MiB (b32e5ba). The “under 30 MiB” fitness function is gone, replaced by limits set from measurements.
One thing that tripped me up while testing: kube-router programs a new pod’s firewall a few seconds after the pod starts. A test pod that checks egress the moment it starts can get through before the policy exists. Test from a pod that has been running for a few seconds.
Watching the watcher #
Alerts that never fire look exactly like an alerting path that’s broken. So one alert always fires:
- alert: Watchdog
  expr: vector(1)
  labels:
    severity: none
    tier: meta
  annotations:
    summary: "Always firing. If Uptime Kuma stops receiving it, the alert path is broken."
Alertmanager never sends it to Telegram. It routes it every minute to a push monitor on Uptime Kuma, which runs on the DMZ observer, a different cloud from the one it’s watching:
# HARD-06: Watchdog never reaches Telegram; it feeds the DMZ Kuma heartbeat every minute
- matchers:
    - alertname = Watchdog
  receiver: 'kuma-watchdog'
  group_wait: 0s
  group_interval: 1m
  repeat_interval: 1m
If Prometheus stops evaluating rules, Alertmanager stops dispatching, or the app host dies, the heartbeats stop and Uptime Kuma alerts. The monitoring is watched by something that doesn’t share its failure domain.
The hypervisor joins #
Until this week the hypervisor’s logs stayed on its own disk. In the power cut, its journal lost its last six and a half hours, so the logs couldn’t say whether it crashed or lost power. On 19 November it got its own Alloy, installed by Ansible as a systemd service, reading the journal and pushing to the same Loki over a new, single-purpose grant (a54372d).
It uses the same node_name label, so LogShippingStalled covers it too. There was one catch. A hypervisor can be quiet for more than half an hour, and silence would trip the alert. A systemd timer writes one log-heartbeat line every five minutes, so a silent stream means shipping has stopped, not that nothing happened.
If Loki is unreachable, Alloy retries for a few minutes and then drops the batch. The lines are still in the local journal (now 500 MB, synced every minute), so the evidence is lost only if the disk goes too.
What I learned #
- Measure the budget before you write it down. “Under 30 MiB” was never true, and the measured numbers made the Alloy decision easy. (ADR-019 addendum)
hostNetworkopts a pod out of NetworkPolicy. An egress rule for a host-network pod is documentation, not enforcement.- Keep labels identical when you swap an agent. Dashboards, queries and alerts are all written against labels. Matching them made the swap a non-event.
- Check every source, every time. A per-node “nothing arrived” alert catches what a one-time check on one node can’t. (INC-2026-006)
- Alert on the alerting path. An always-firing alert, watched from somewhere else, is the only way to tell silence from success.
Architecture takeaways #
Why node-level agents are DaemonSets #
A log agent has to run where the logs are, and container logs live on each node’s disk. A Deployment schedules pods wherever there’s room, so it can’t promise one agent per node. A DaemonSet does exactly that: one pod on every matching node, added automatically when a node joins and removed when it leaves. The Alloy values tolerate every NoSchedule taint, so a taint like a control-plane one can’t keep the agent off a node, and kube-system logs still get collected.
Why containers log to stdout and the node keeps the files #
Kubernetes doesn’t want an app to manage its own log files. The container writes to stdout and stderr, the runtime writes those streams to /var/log/pods/ on the node, and the kubelet rotates them. That gives every agent one place and one format to read (the CRI format Alloy parses with stage.cri), whatever language the app is written in. It also means logs outlive a crashing container, for a while, which is what lets a restarted agent catch up from its saved position.
Why hostNetwork bypasses NetworkPolicy
#
NetworkPolicy is enforced on a pod’s own network interface, inside the pod network. A hostNetwork pod has no interface of its own: it shares the node’s, so most network plugins have nothing to attach the policy to. That’s why Promtail’s egress rule did nothing, and why the fix was to move the agent onto the pod network rather than write a better rule.
Previous: Stopping an App Is a Change · All posts in the series