

Project Aether has a cloud VM whose only job is to watch everything else from outside. It sits in a DMZ, it is deliberately low-trust, and the access policy lets it probe a handful of services on my app host and nothing more. In early November an audit found that it hadn’t passed a single check against the app host in three days.
Fixing that took a week. Every fix exposed the next problem, and the worst moment came from my quick fix, not from the original failure. For a few hours the low-trust DMZ machine could reach my Docker UI, my log viewer and my alert manager. A check I had planned for exactly that case caught it the same day.
This post walks through the week in four acts, using the three incident reviews I wrote along the way (INC-2026-002, INC-2026-003 and INC-2026-009). It ends with the design that makes this class of failure impossible: tags set by configuration, one meaning per tag, and policy tests that run on every save.
The setup #
If you haven’t read the series overview, here is the short version of the parts that matter:
- The app host is an Oracle Cloud ARM VM running my Docker Compose services.
- The DMZ observer is a Google Cloud VM running Uptime Kuma. It watches the app host from outside, so it can raise the alarm when the app host can’t.
- Everything talks over a Tailscale tailnet. Access is granted by tag: a policy rule says “devices with tag X may reach devices with tag Y on these ports”.
- The services on the app host are published to the tailnet by tsdproxy, which runs one Tailscale node per service. Each service gets its own name and address on the tailnet.
That last point is where the trouble started.
Act 1: The observer went blind #
The audit found the DMZ’s app-host monitors had passed 0 of about 2,600 checks in 72 hours. They weren’t reporting “down” in the usual sense. The DMZ couldn’t even resolve the services’ names: DNS answered “no such host”.
That was the first clue. Tailscale only shows a node the peers its policy lets it reach. The policy let the DMZ reach nodes with one tag, and the services had lost that tag, so they had disappeared from the DMZ’s view of the network entirely.
Why had they lost it? tsdproxy v1 signs every service in with a single, untagged auth key. I had added the tags by hand in the admin console. That held until the container was recreated. On a recreate, tsdproxy signed the node in again with its untagged key, and Tailscale reset the node’s tags to the key’s tags, which were none. tsdproxy logs nothing when this happens.
And something recreated containers every night: an image auto-updater, at 04:00.
The proof was in the timing. The 11 services that lost their tags were exactly the 11 whose containers had been recreated after 28 October 04:05. The 5 that kept their tags hadn’t been recreated since. With an 11-of-11 match, I didn’t need to wait for the next reset to reproduce it.
For at least three days, a real outage on the app host would have looked exactly like this false one.
Act 2: The quick fix, and the check that caught it #
The fast fix looked obvious. Tag every proxied service with the app host’s environment tag, the tag the DMZ was already allowed to reach. I did that by hand, and the monitors turned green.
My fix plan had a second line after “monitoring works”: nothing new is reachable. Specifically, the metrics dashboard must not answer from the DMZ. It answered.
A sweep from the DMZ found it could get an HTTP response from 16 of 17 proxied services on the app host:
Here is the same sweep before and after the corrected policy. Each cell is the HTTP status that curl printed from the DMZ with a five-second timeout. 000 means no response at all: the connection never completed.
| Service on the app host | After the quick fix | After the corrected policy |
|---|---|---|
| Uptime monitor (probe target) | 200 / 302 |
200 / 302 |
| Book library (probe target) | 200 / 302 |
200 / 302 |
| The app host’s own node (probe target) | 200 |
200 |
| Alert manager | 200 |
000 |
| Container log viewer | 200 |
000 |
| Metrics dashboard | 302 (login page) |
000 |
| Docker management UI | HTTP reply | 000 |
| Metrics server | HTTP reply | 000 |
| The other 9 proxied services | 8 replied, 1 did not | 000 |
The first three rows are the only ones the DMZ is meant to see, and they never changed. Everything below them went from answering to silent, which is what “nothing new is reachable” looks like when it passes.
The cause was an old grant I had forgotten about: the DMZ may reach the environment tag on ports 80 and 443. When I wrote it, only the app host itself carried that tag. Tagging every service with the same tag silently extended that grant to all of them, admin tools included. Nothing in the policy said which services the DMZ was supposed to reach, so nothing failed when the set grew.
That was the tag that meant two things. It meant “runs on the app host” and it also meant “the DMZ may reach it”. Fixing monitoring through the first meaning moved the security boundary through the second.
The console said “saved” #
I wrote a corrected policy and saved it in the admin console. The console reported success.
The second check, at the destination this time, said otherwise. The app host’s packet filter still admitted the DMZ on port 80, a port only the old grant allowed. The policy file had picked up a stray paste and was invalid, and the policy that had actually been saved was the old one. I pasted the clean policy again, and this time the packet filter admitted the DMZ on 443 only.
I read the filter on the app host itself, from its own copy of the network map. Tailscale’s coordination server compiles the policy into a packet filter and pushes it to every node, and tailscale debug netmap prints what that node actually received:
# on the app host; DMZ_IP is the DMZ node's tailnet address
tailscale debug netmap \
  | jq -r --arg src "$DMZ_IP/32" '
      .PacketFilter[]
      | select(.Srcs | index($src))
      | .Dsts[]
      | "\(.Net)\t\(.Ports.First)-\(.Ports.Last)"'
It prints one line per destination and port range that the DMZ is allowed to reach on that node. With the old policy saved, the output still contained a 80-80 line. With the corrected one, it held only 443-443. The field names (Srcs, Dsts, Ports) match the client version I run today, so if the filter prints nothing, look at the raw JSON first.
The DMZ VM runs only monitoring and a dashboard, so an attacker would have needed to compromise it first, and the window was hours, not weeks. It was still a SEV1 in my book, because the exposure was real.
Act 3: Stop the bleeding, then encode the boundary #
The same day (commit 13fca25):
- Deleted the broad grant. The DMZ no longer gets anything just for carrying the environment tag.
- Added a dedicated probe tag that grants the DMZ the monitored services on 443 only.
- Pinned the two probe targets by address. Tags still reset on a recreate, but a node keeps its address, so the monitors would survive the next 04:00 run without widening access again.
- Added a
testsblock to the policy. The admin console runs it on every save and rejects a policy where the DMZ can reach the environment tag on 80 or 443, or where the probe paths stop working.
The core of the block is one test for the DMZ, shown here trimmed. accept lists what must work and deny lists what must never work:
"tests": [
  {
    "src":    "tag:gcp-dmz",
    "accept": ["tag:oci-probe:443", "oci-uptimekuma:443", "oci-<public-app>:443"],
    "deny":   ["tag:oci:443", "tag:oci:80"],
  },
]
If a later edit lets the DMZ reach anything in deny, or stops it reaching anything in accept, the console refuses the save and names the failing line.
The verification ran from both ends: the three probe targets answered from the DMZ, every admin tool timed out, and the destination’s packet filter admitted 443 only.
One more surprise turned up two days later. I had switched the auto-updater to notify-only on 3 November, and the settings page looked right. But on 5 November it recreated four more containers. The tool’s run history showed why: I had changed the setting on the DMZ’s environment in the update tool, not the app host’s. The pinned addresses kept the monitors up through both nights, which was reassuring, and I fixed the setting on the right environment that day.
Act 4: The durable fix, and its landmines #
Pinning addresses was a patch. The real problem was that a node’s identity came from a click in a console, and a routine operation could undo it. The durable fix is in ADR-013’s addendum: tags set by configuration, one meaning per tag.
| Tag | Carried by | Who may reach it |
|---|---|---|
tag:oci |
The app host’s own node only | Operator, other tag:oci, the cluster on the Loki port |
tag:oci-app |
User-facing apps | Operator |
tag:oci-probe |
Services the DMZ monitors (with tag:oci-app) |
Operator, DMZ on 443 |
tag:oci-admin |
Docker UI, log viewer, workflow engine, Prometheus, Grafana, Loki, Alertmanager | Operator only, never the DMZ |
Location is never used to grant access any more.
The change is easiest to see side by side. Before, one tag answered two questions. After, location and permission are separate.
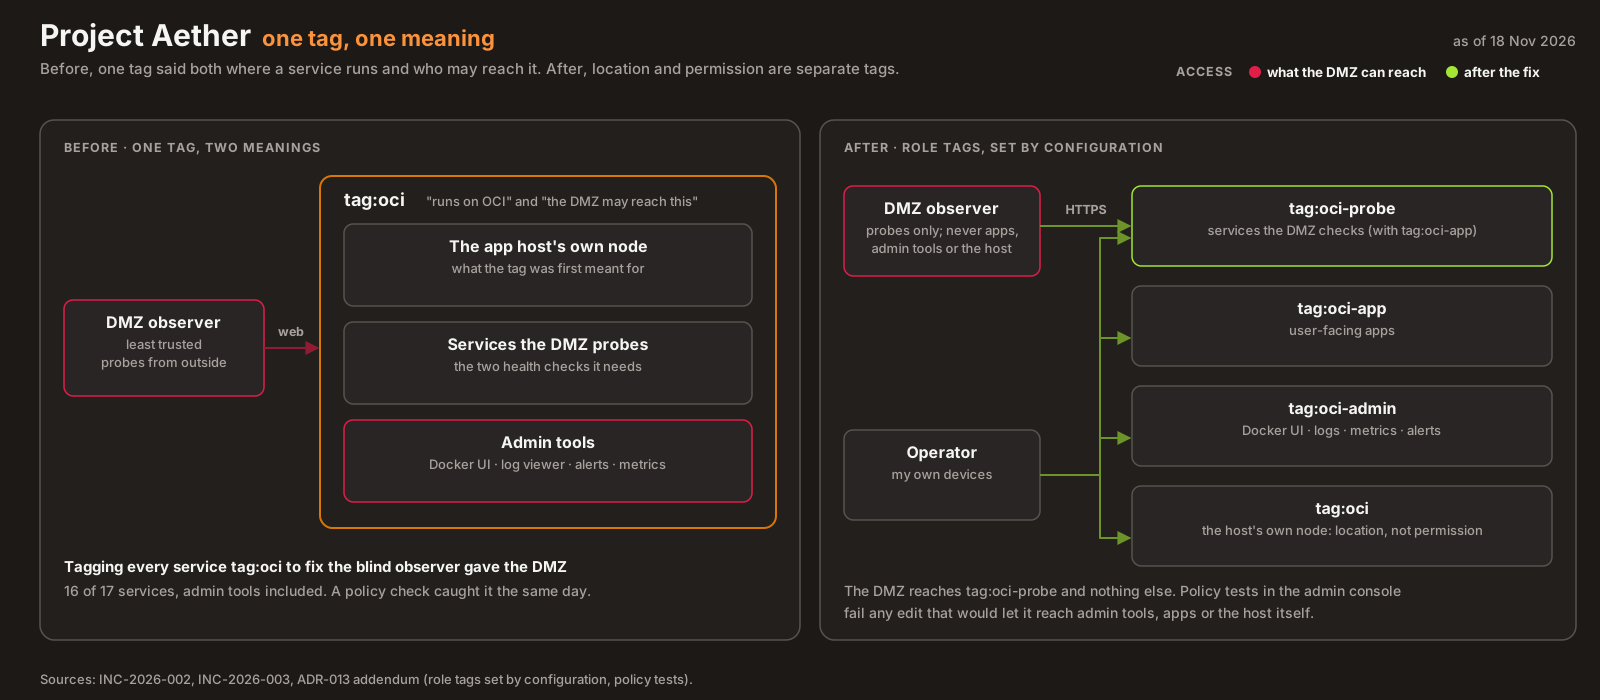
tsdproxy v2 makes this possible. It signs nodes in through an OAuth client instead of a shared auth key, and it supports several providers, each with its own tags. A container picks its provider with the label tsdproxy.proxyprovider, and the default is app. Node state is kept per provider, so a recreated container keeps its node, its address and its tags. Here is the provider section of the Ansible template:
tailscale:
  # One provider per role: proxies that share a credential get the same tags.
  # Pick one with the container label tsdproxy.proxyprovider; no label means "app".
  providers:
    app:
      clientId: "{{ oci_tsdproxy_oauth_client_id }}"
      clientSecret: "{{ oci_tsdproxy_oauth_client_secret }}"
      tags: "tag:oci-app"
    probe:
      clientId: "{{ oci_tsdproxy_oauth_client_id }}"
      clientSecret: "{{ oci_tsdproxy_oauth_client_secret }}"
      tags: "tag:oci-probe,tag:oci-app"
    admin:
      clientId: "{{ oci_tsdproxy_oauth_client_id }}"
      clientSecret: "{{ oci_tsdproxy_oauth_client_secret }}"
      tags: "tag:oci-admin"
The plan was a few minutes of downtime while every node was replaced. It took 30 minutes, from 09:35 to 10:05 UTC on 6 November, with a tail that lasted until the next night. Here’s what went wrong, and the one thing that didn’t.
The bug I avoided: tsdproxy #496 #
Upstream issue #496 had broken this exact setup before. With no config file, v2 generates defaults that proxy every service to host.docker.internal, and every service that publishes no host port returns 502. On my app host that was 16 of 18 containers. Because I found the issue while planning, the config was written explicitly and that failure never happened:
docker:
  local:
    host: unix:///var/run/docker.sock
    defaultProxyProvider: app
    # tsdproxy #496: reach containers over proxied-net. No targetHostname: v2's generated
    # default (host.docker.internal) returns 502 for every service that publishes no host port.
    tryDockerInternalNetwork: true
Landmine 1: a missing OAuth scope #
I stopped v1, deleted the 16 old nodes, and started v2. Every proxy failed at once:
OAuth client cannot grant scopes "devices:core auth_keys"tsdproxy 2.3.4 asks for both devices:core and auth_keys. My plan only named auth_keys, and OAuth scopes can’t be edited after the client is created. The fix was a new client.
Landmine 2: minting a key for part of a tag set #
With the new client, every proxy failed again:
400 requested tags [tag:oci-app] are invalid or not permittedI tested against the API rather than guessing. A key for all three of the client’s tags succeeded. A key for one tag alone failed. That took about three minutes, and it showed a rule the console doesn’t make obvious:
- An OAuth client can mint a key for exactly its full tag set without consulting
tagOwners. - For a subset, each requested tag must be owned by one of the client’s own tags. Ownership by
autogroup:admindoesn’t count.
The fix was to make each role tag its own owner: "tag:oci-app": ["autogroup:admin", "tag:oci-app"]. It’s the same pattern the Tailscale Kubernetes operator uses, with tag:k8s owned by tag:k8s-operator. Self-ownership grants nothing new, because a node can only advertise a tag it already has.
Landmine 3: order of operations #
At 09:50 all 16 nodes signed in, but six admin services came up on the app provider because I hadn’t deployed their new labels yet. I stopped the proxy again, deleted the six wrong nodes and their state, deployed the labels, and started it once more. Everything was up with the right tags at 10:05.
This is where Act 3 paid off. Those six admin services landed on app, which the DMZ can’t reach. Before the Act 3 fix, the same slip would have opened admin tools to the DMZ for 15 minutes.
Landmine 4: sixteen new certificates at once #
Every node was new, so every node needed a TLS certificate. tsdproxy requests them two at a time, and at 10:07 five requests failed with context deadline exceeded while waiting in the queue. By 10:27, 11 of 16 services had certificates.
The other five, including Grafana, Loki and Alertmanager, stayed unreachable by URL for about 14 hours. The containers ran and Prometheus kept collecting the whole time; only browser access was missing. tsdproxy doesn’t retry a failed certificate request until someone visits the service. When I visited each one at 00:06 UTC the next night, they all got certificates within six minutes.
Why it took everything down at once #
I couldn’t canary this. A second proxy instance would have claimed every labelled container on the same Docker socket, so all 16 nodes had to switch together, and any credential mistake stopped everything. What I should have done is ask the API for one test key per provider while v1 was still serving. That would have caught both credential errors before anything went down.
One last honest note: while debugging the policy under time pressure, a quick inline script read the decrypted secrets file the wrong way, and its error message printed one app’s session secret into my local terminal. It went nowhere else, and I rotated it. My diagnostic scripts now read secrets from a file and print only key names and status codes.
What I learned #
- Every access fix needs a negative test. “The thing I wanted now works” says nothing about what else became reachable. The “nothing new is reachable” line in my plan is the only reason Act 2 lasted hours.
- One tag should have one meaning. A tag that means both “where it runs” and “who may reach it” lets a monitoring fix move a security boundary.
- Identity has to come from configuration. Anything a routine operation can reset will eventually be reset. In my case that was a container recreate at 04:00.
- Read the data plane and the run history. The console’s “saved” banner showed what the console accepted, not what the nodes enforced. The updater’s settings page showed what I meant to change, not what ran.
- Prove a shared credential works before cutting over. When one credential gates every node, one test key per provider is cheap insurance.
- A planned change is still an incident if it takes things down. Thirty minutes of every tailnet URL down got a review like any other (INC-2026-009).
Architecture takeaways #
Access should follow role, never location #
The broken grant was written against where something ran: “the DMZ may reach the app host”. That stayed safe only as long as one thing ran there. Once location and permission shared a name, any change to what ran on the host changed who could reach it. The role tags fix that by keeping the two apart. tag:oci now says where a node lives and grants nothing on its own, and the role tags say who may reach it. Kubernetes NetworkPolicy has the same trap with labels: a label used for both grouping and security will one day be added to a pod for the grouping reason.
Identity belongs to the workload’s configuration #
In v1, a service’s identity was a click in a console, and a routine container recreate wiped it. In v2 it is declared next to the service, as a label that picks a provider, so recreating the service rebuilds the same identity. Anything that has to survive a redeploy should live in the same place as the deploy.
State the boundary as a test #
Before the tests block, the policy said what was allowed and nothing about what must never happen. Growing the set of reachable services broke no rule, because no rule existed. A negative assertion (“the DMZ cannot reach tag:oci-admin”) turns a boundary from something I remember into something the console enforces on every save.
A shared credential is a shared failure domain #
One OAuth client gated all 16 nodes, and the proxy couldn’t run two instances side by side, so the cut-over had no canary. Every credential mistake hit everything at once. When a design forces an all-at-once change, the test has to happen before the change: one test key per provider, while the old version is still serving.
Previously in the series: fan noise and phantom shutdowns on the hypervisor. Every part is listed on the series page.